Here is a very interesting article by AFL historian, Dave Steidel. The AFL was lambasted in early years as an “all-pass, no defense” league. However, Steidel presents raw numbers that should change that way of thinking.
In the first half of their decade the AFL was often criticized for, and deemed less of a league because of, what was thought to be an inordinate amount of passing. But many AFL advocates felt that it was more of a league because of it aerial dynamics. NFL purists felt that the only way to play football was to employ predictable runs through and over opponents. And because Vince Lombardi was preaching that “the running game is what pro football is all about” many others were following his formula in lockstep formation. To their credit and foresight, the AFL did not want to offer more of the same. What the AFL had was wide open long-distance offenses that attracted a new generation of fan. As a result, AFL games were more exciting to watch with the anticipation of a possible score on every play. So it was by design that they passed and ran in a more wide open style. As many will testify, the new league survived and flourished because of it.
The AFL was able to move beyond the stereotypical manly-man game plan of the NFL and was able to see beyond that concept and into the future. Those who became fans of the AFL wanted something different and something less predictable than the game the NFL was offering. But again, what was being reported to football fans across the country was not as accurate as the facts themselves. Described as basketball on cleats, fans were led to believe that the pass to run ratio of the AFL was in the neighborhood 6 passes to every run. But as the facts show in the chart below, it was more of a 1:1 ratio and more in line with the NFL numbers than the NFL and its supporters wanted fans to believe.
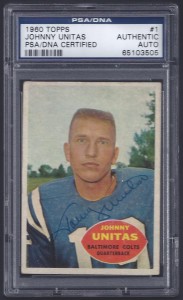
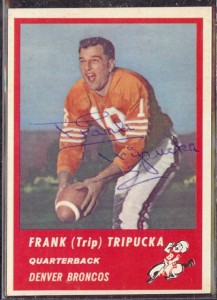
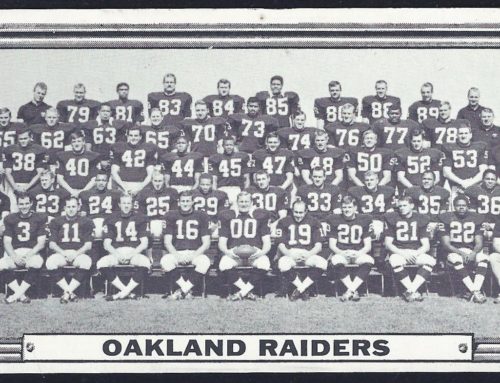
 An analysis of NFL and AFL team statistics shows that in 1960 Johnny Unitas and his Colts were taking to the air more often than half of the AFL teams. Baltimore led the NFL with 32.6 pass attempts per game followed by the Cowboys at 29.5, San Francisco 28, LA, 27.9, Detroit 27.75, the champion Eagles 27.58 and Chicago Bears 27. The AFL numbers show that the Broncos threw only 4 more passes per game than the Colts! Denver, with 36.2 passes per game led the AFL, Boston had 33.9 attempts, the Titans 33.8 and the Raiders with 33 were the other AFL teams who threw seemingly more than Baltimore. But, if you consider that the AFL ran 4.3 more plays per game, and if half of those plays were passes, the “pass-happy” Broncos threw only two more times each game than the Colts and the Colts were throwing more than all of the AFL teams except Denver! The Dallas Texans threw the least number of passes per game in the AFL with 31. Looking deeper, of the top seven passing teams in the NFL, six were from the “running” western division. In other words, it was only the Lombardi Packers in the West who resisted the AFL way.
As the NFL added a 14th team in 1961 their number of plays per team each game dropped from 59 to 58.2. The number of plays per team in an AFL game also dropped from 63.3 to 61.1, and the plays per game differential dropped from 4.3 to only 2.9 between the two leagues. The passing differential also dropped from 6.6 in 1960 to 5.4 more throws per game in 1961 and in 1962 the AFL was throwing only 3.6 more passes per game than the NFL. As the years progressed the NFL passes per game rose to equal the AFL’s, while their number of running plays also dropped to equal that of the newer league. Isn’t interesting how the league that was doing all the criticizing in 1960 had become the clone by 1969! So what was all the hubub about and why do all the gatekeepers of the HOF still feel that the AFL was any less of a league?
NFL and AFL comparison chart of running and passing plays per game in the 1960’s
NATIONAL FOOTBALL LEAGUE
| RUNNING | PASSING | ||||
| Attempts | Avg. | teams | Attempts | Avg. | |
| 1960 | 5091 | 32.6 | 13 | 4114 | 26.4 |
| 1961 | 6106 | 31.2 | 14 | 5292 | 27 |
| 1962 | 6064 | 30.9 | 14 | 5356 | 27.3 |
| 1963 | 6112 | 31.2 | 14 | 5415 | 27.6 |
| 1964 | 6080 | 31 | 14 | 5437 | 27.7 |
| 1965 | 6031 | 30.8 | 14 | 5407 | 27.6 |
| 1966 | 6509 | 31 | 15 | 6108 | 29.1 |
| 1967 | 6868 | 30.7 | 16 | 6451 | 28.8 |
| 1968 | 7059 | 31.5 | 16 | 5997 | 26.8 |
| 1969 | 6831 | 30.5 | 16 | 6345 | 28.3 |
AMERICAN FOOTBALL LEAGUE
| RUSHING | PASSING | ||||
| Attempts | Avg. | teams | Attempts | Avg. | |
| 1960 | 3391 | 30.3 | 8 | 3699 | 33 |
| 1961 | 3218 | 28.7 | 8 | 3630 | 32.4 |
| 1962 | 3285 | 29.3 | 8 | 3456 | 30.9 |
| 1963 | 3066 | 27.4 | 8 | 3539 | 31.6 |
| 1964 | 3113 | 27.8 | 8 | 3750 | 33.5 |
| 1965 | 3203 | 28.6 | 8 | 3652 | 32.6 |
| 1966 | 3648 | 29 | 9 | 3982 | 31.6 |
| 1967 | 3710 | 29.4 | 9 | 3878 | 30.8 |
| 1968 | 4435 | 31.7 | 10 | 4037 | 28.8 |
| 1969 | 4254 | 30.4 | 10 | 4032 | 28.8 |


I don’t think it was the sheer numbers of passes in the early years of the AFL that were relevant. I believe it was pass efficiency between the leagues that was significantly different. I will provide statistics in another post that indicate NFL passers from 1960-1965 were much more efficient. Yards per completion, completion percentage and TD to Int. ratio was far better in the NFL. And while of this could be placed on a long pass preference, much of the difference was due to superior NFL quarterbacking during that period.
During the second half of the 1960’s the AFL teams quality both in passing efficiency and overall defensive ability increased dramatically. The Jets and Chiefs Super Bowl wins affirming that point.
Heck, I thought this was going to be about Hank Stram trying to sign Wilt Chamberlain to a Chiefs contract in the mid-60’s. He had the connection (Wilt went to Kansas) and Wilt had the ability, but the Philadelphia Warriors weren’t interested in their star getting knocked around fourteen weekends a year. Later, Hank drafted 6’10” Morris Stroud, but Morris was no Wilt Chamberlain.
Presume ‘Tales From The American Football League’ have seen this old article (link below) from 2009, but it addresses some of today’s blog subject:
http://www.coldhardfootballfacts.com/content/everything-you-know-about-the-afl-is-wrong/6911/
Whether correct in their analysis or adherents of that old adage ‘you can make statistics say whatever you want them to’, if in fact the AFL and NFL were more alike than has been proffered, then Vince Lombardi’s disdain for the AFL gives pause for a bit of a chuckle.
If you can’t beat ’em, join ’em? : )
Course in the beginning, the NFL did beat ’em… eventually of course, there was no difference, per se – other than the fact that by the end of the 1960’s, the little league that could – AFL – had surpassed the NFL to the tune of 16-7 and 23-7.
Watching Lombardi – who I still believe is the best ever – look a bit perplexed at Superbowl IV just a few months before his death, affirmed that it was indeed an whole new league ‘the NFL’ that beckoned come the 1970 season.
Regardless of ‘stats’, having watched both leagues in the 1960’s, the pageantry of the AFL was (nod toward the NBC TV peacock) like watching football in color compared to black & white, NFL/CBS.
The difference was dramatic in my mind & I haven’t been convinced otherwise by any article/stats since… you can’t put an value on the excitement factor.
Long live the AFL!
My point in writing this article was not about accuracy passers – only the “perceived” abundance of passing in the AFL. The NFL bias media looked for every way to discredit the AFL and made up stories that the AFL was just a passing ‘basketball on cleats’ league with little substance of what they believed football should be. They wanted readers to think that passing was the cowards way out to play football.
It was two guys Charlie Hennigan and Lionel Taylor with a dash of Abner Haynes and Art Powells touchdown sprees, nothing more nothing less, the league suffered from the Art Luppino, Jim Preacher Pilot Border Conference syndrome, big numbers, minor league.
Basketball in cleats some time ago I was reviewing NFL Draft lists and found KC Jones was drafted by the Rams in the 30th round in 1955. KC may have been the first collegiate basketballer to be an NFL draftee. KC was the guard on Phil Wolpert’s back to back NCAA basketball Champion USF Dons with Bill Russell. The way Woolperts life ended up has never been fully explained, like many tragic acts, ends in a hush, not talked about, too painful and then over time forgotten.
… [Trackback]
[…] Find More Information here to that Topic: talesfromtheamericanfootballleague.com/basketball-on-cleats/ […]
… [Trackback]
[…] Read More Info here to that Topic: talesfromtheamericanfootballleague.com/basketball-on-cleats/ […]
… [Trackback]
[…] Here you will find 61927 additional Information on that Topic: talesfromtheamericanfootballleague.com/basketball-on-cleats/ […]
… [Trackback]
[…] Info to that Topic: talesfromtheamericanfootballleague.com/basketball-on-cleats/ […]
… [Trackback]
[…] Find More on on that Topic: talesfromtheamericanfootballleague.com/basketball-on-cleats/ […]
… [Trackback]
[…] Find More on that Topic: talesfromtheamericanfootballleague.com/basketball-on-cleats/ […]
… [Trackback]
[…] There you can find 88810 more Information to that Topic: talesfromtheamericanfootballleague.com/basketball-on-cleats/ […]
… [Trackback]
[…] Here you will find 53157 additional Info on that Topic: talesfromtheamericanfootballleague.com/basketball-on-cleats/ […]
… [Trackback]
[…] Read More here to that Topic: talesfromtheamericanfootballleague.com/basketball-on-cleats/ […]
… [Trackback]
[…] Read More Information here on that Topic: talesfromtheamericanfootballleague.com/basketball-on-cleats/ […]
… [Trackback]
[…] Find More here to that Topic: talesfromtheamericanfootballleague.com/basketball-on-cleats/ […]
… [Trackback]
[…] Info to that Topic: talesfromtheamericanfootballleague.com/basketball-on-cleats/ […]
… [Trackback]
[…] Find More here to that Topic: talesfromtheamericanfootballleague.com/basketball-on-cleats/ […]
… [Trackback]
[…] Find More here on that Topic: talesfromtheamericanfootballleague.com/basketball-on-cleats/ […]
… [Trackback]
[…] Here you will find 25498 additional Info to that Topic: talesfromtheamericanfootballleague.com/basketball-on-cleats/ […]
… [Trackback]
[…] Find More to that Topic: talesfromtheamericanfootballleague.com/basketball-on-cleats/ […]
… [Trackback]
[…] Find More on on that Topic: talesfromtheamericanfootballleague.com/basketball-on-cleats/ […]
… [Trackback]
[…] Find More to that Topic: talesfromtheamericanfootballleague.com/basketball-on-cleats/ […]
… [Trackback]
[…] Here you can find 42186 additional Info on that Topic: talesfromtheamericanfootballleague.com/basketball-on-cleats/ […]
… [Trackback]
[…] There you can find 48547 additional Info to that Topic: talesfromtheamericanfootballleague.com/basketball-on-cleats/ […]
… [Trackback]
[…] Read More here on that Topic: talesfromtheamericanfootballleague.com/basketball-on-cleats/ […]
… [Trackback]
[…] Find More on that Topic: talesfromtheamericanfootballleague.com/basketball-on-cleats/ […]
… [Trackback]
[…] Find More to that Topic: talesfromtheamericanfootballleague.com/basketball-on-cleats/ […]
… [Trackback]
[…] Find More on on that Topic: talesfromtheamericanfootballleague.com/basketball-on-cleats/ […]
… [Trackback]
[…] There you will find 97798 additional Information to that Topic: talesfromtheamericanfootballleague.com/basketball-on-cleats/ […]
… [Trackback]
[…] Read More to that Topic: talesfromtheamericanfootballleague.com/basketball-on-cleats/ […]